
Sumeet Madan
With a remarkable 18-year tenure in software engineering, agile training, coaching, and consulting,... Read more
No courses found...
No courses found...

Sumeet Madan
With a remarkable 18-year tenure in software engineering, agile training, coaching, and consulting,... Read more

Note: I have written this article assuming the reader has working experience in Agile and know the concept of Velocity
The dictionary meaning of Velocity is "The speed of something in a given direction," and Physics say, "The Velocity is the rate of change of the position of an object concerning a frame of reference and is a function of time."
But we are into a world (Software Driven Corporate) that Agility drives. In the Agile world, the Velocity means "The amount of work (Units or Value or Work Items) that was delivered to create a potentially releasable Increment in a Sprint."
In my experience, "Velocity" is used to measure the Productivity of the Development Team.
Is "Velocity" a measure of Productivity or Predictability? I haven't come across any definition of Velocity where the word Productivity is used.
Stable Velocity means a team is predictable on their delivery or, would say, outcome.
When developers are working in Sprints or iterations, for the first initial sprints, the forecasted range of Velocity could be high due to the new teams working and the uncertainties that pop up. Still, after spending few Sprints, the Uncertainty reduces, and a team becomes more predictable, and this is where Velocity is an excellent instrument for Predictability.
Join our Product Owner PSPO Training for top-notch instruction from Naveen and Sumeet. With a 100% success track record, your training success is assured.
REGISTER TODAY
Consider the initial Product Backlog is estimated (say in points or any units), and the work in backlog comes out to be 500 Units (with the initial estimates). Consider a team that has worked on the same kind of work that needs to be done on the Product, and this teams' Velocity (turning PBIs into a potentially releasable DONE Increment) was 50 units.
By simple calculation, for 500 Units to be delivered with a team that has a past Velocity of 50 units, needs 10 Sprints (500 Units / 50 Units)
Consider this team started working together, and during the 1st Sprint planning, they picked up 50 units of work. When the team began to work, they uncovered uncertainties and were able to deliver only 10 units.
As some work was done in the previous Sprint and the 2nd Sprint, they forecasted 50 units and delivered 50 Units of work. Now, how much work should they pick in the 3rd Sprint, or how much will they be able to deliver? – This is uncertain now.
Let's create a quick visual on this
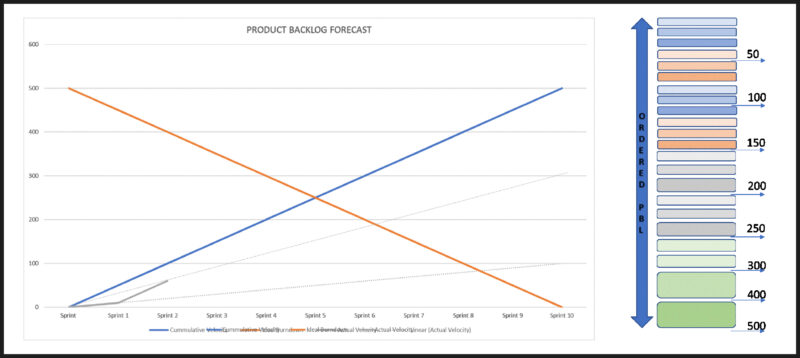
Consider, during the review, and a Stakeholders ask how much work can be delivered by the end of the 7th Sprint, the PO can use this graph to forecast the work delivered by the end of the 7th Sprint.
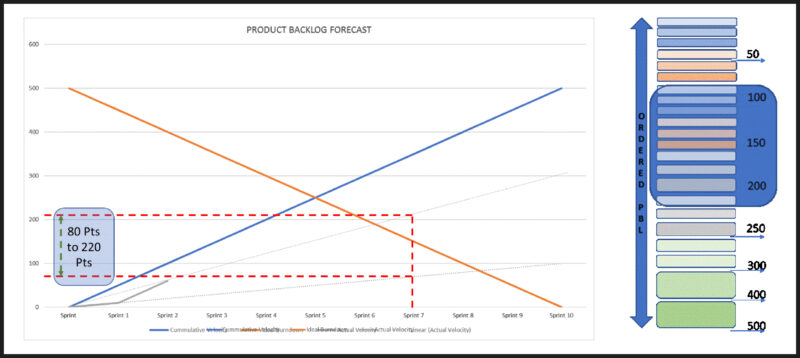
The graph above predicts the team may deliver anything between 80 – 220 Pts/units of work. This level of Uncertainty in predicting is termed as the Cone of Uncertainty.
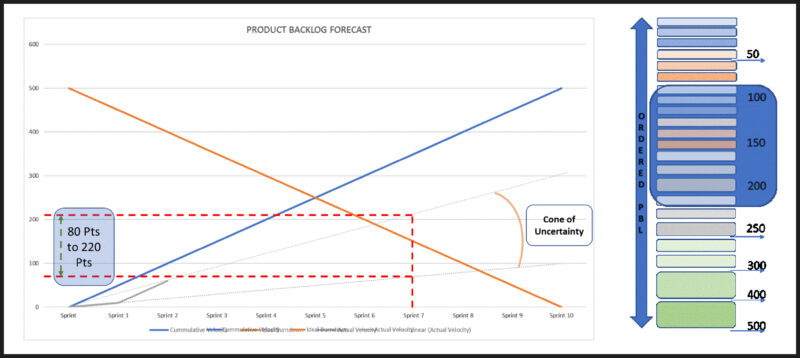
As the Cone of Uncertainty is high, the forecast range will be big, i.e., 80 Pts/units to 220 Pts/units, and this will be the case in the initial time of Product Development.
As the team progresses, the uncertainties usually get clear with initial validations on the Product's requirements.
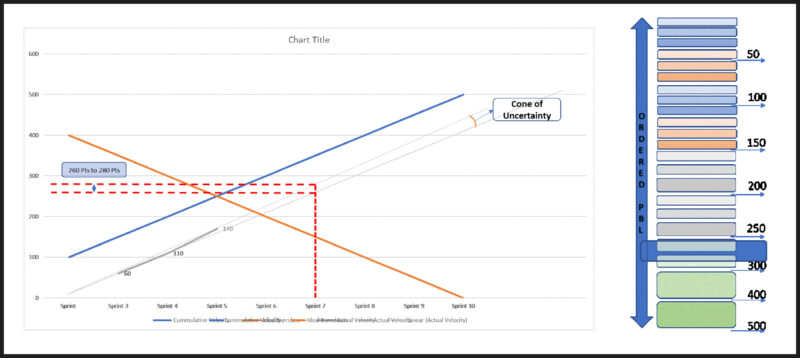
Consider that team has gone through the first initial iterations/sprints, and now the uncertainties are clear, and developers are delivering as per their forecast, which reduces the Cone of Uncertainty. Forecast, therefore, becomes realistic, and teams become more predictable.
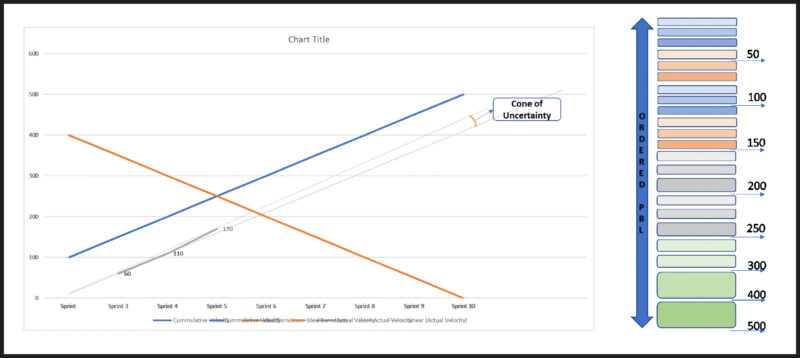
Now during the review, if Stakeholders ask that how much work can be delivered by the end of 7th Sprint, then PO can use this graph to forecast the work again, and this time this range is more predictable (like 260 Units to 280Units)
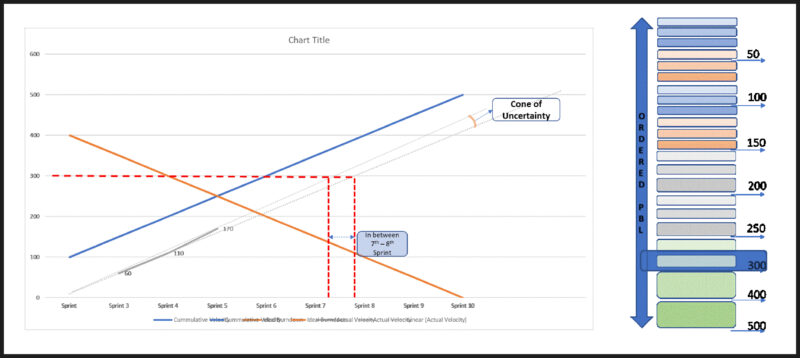
During the review, if some stakeholders ask about by which Sprint we can get the work of 300th Unit (considering the work falls there), then reverse plot help provide a forecast of any time by the end of 7th or 8th Sprint
These are a few ways the Product Owner can use Velocity to raise transparency around Product Backlog to raise transparency at different levels (wherever required) of the business.
My small attempt to put my experience on how I raised the transparency in the Product Development via Product Backlog. Please help.

With a remarkable 18-year tenure in software engineering, agile training, coaching, and consulting, Sumeet's expertise is unparalleled. As a certified Professional Scrum Trainer (PST) from Scrum.org and a distinguished SAFe® Practice Consultant (SPC), Sumeet brings a wealth of knowledge and skill to every project, making a lasting impact on organizations seeking to embrace Agile methodologies.
WhatsApp Us

We will get back to you soon!
For a detailed enquiry, please write to us at connect@agilemania.com

